

| Danish Production of Oil, Gas and Water for January 2018 | ||||||
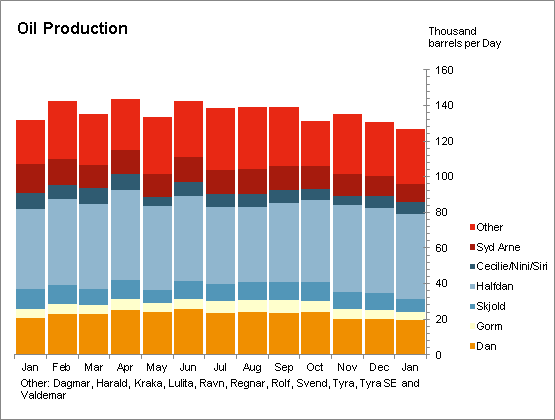
| Oil, 1000 barrels | January 2018 | Oct17-Dec17 | Oct16-Dec16 | This year |  | |
| Field | Monthly | Daily Avg. | Daily Avg. | Daily Avg. | ||
| Dan | 598,0 | 19,3 | 21,2 | 21,1 | 598,0 | |
| Gorm | 151,1 | 4,9 | 6,0 | 6,3 | 151,1 | |
| Skjold | 217,2 | 7,0 | 9,6 | 10,7 | 217,2 | |
| Tyra | 209,1 | 6,7 | 6,8 | 6,8 | 209,1 | |
| Rolf | 21,1 | 0,7 | 0,8 | 1,2 | 21,1 | |
| Kraka | 69,1 | 2,2 | 1,9 | 2,0 | 69,1 | |
| Dagmar | - | - | - | - | - | |
| Regnar | - | - | - | - | - | |
| Valdemar | 361,4 | 11,7 | 10,5 | 13,6 | 361,4 | |
| Roar | 56,9 | 1,8 | 1,9 | 0,4 | 56,9 | |
| Svend | - | - | - | - | - | |
| Harald | 5,6 | 0,2 | 0,2 | 0,4 | 5,6 | |
| Lulita | 9,9 | 0,3 | 0,6 | 0,5 | 9,9 | |
| Halfdan | 1.476,0 | 47,6 | 47,7 | 46,7 | 1.476,0 | |
| Siri | 106,0 | 3,4 | 3,0 | 3,7 | 106,0 | |
| Syd Arne | 312,0 | 10,1 | 12,1 | 17,3 | 312,0 | |
| Tyra SE | 227,8 | 7,3 | 6,6 | 5,9 | 227,8 | |
| Cecilie | 19,2 | 0,6 | 0,5 | 0,7 | 19,2 | |
| Nini | 86,3 | 2,8 | 2,6 | 5,0 | 86,3 | |
| Ravn | 7,3 | 0,2 | 0,2 | - | 7,3 | |
| Total | 3.933,8 | 126,9 | 132,4 | 142,1 | 3.933,8 | |
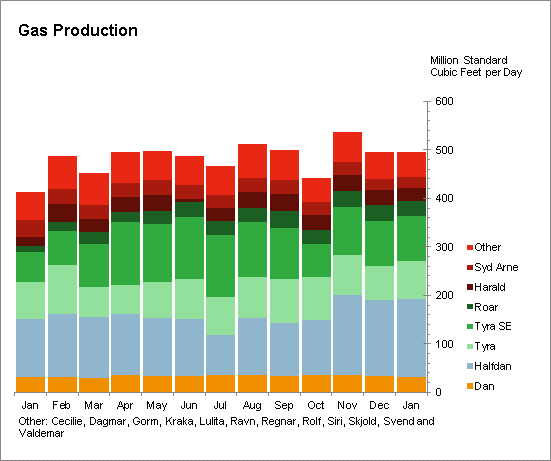
| Gas, MMscf | January 2018 | Oct17-Dec17 | Oct16-Dec16 | This year |  | |
| Field | Monthly | Daily Avg. | Daily Avg. | Daily Avg. | ||
| Dan | 983,8 | 31,7 | 35,8 | 31,0 | 983,8 | |
| Gorm | 100,9 | 3,3 | 5,1 | 5,3 | 100,9 | |
| Skjold | 166,1 | 5,4 | 11,4 | 5,7 | 166,1 | |
| Tyra | 2.466,9 | 79,6 | 80,8 | 105,4 | 2.466,9 | |
| Rolf | 4,5 | 0,1 | 0,1 | 0,2 | 4,5 | |
| Kraka | 115,5 | 3,7 | 3,4 | 4,2 | 115,5 | |
| Dagmar | - | - | - | - | - | |
| Regnar | - | - | - | - | - | |
| Valdemar | 1.025,3 | 33,1 | 28,8 | 33,7 | 1.025,3 | |
| Roar | 914,3 | 29,5 | 32,1 | 10,5 | 914,3 | |
| Svend | - | - | - | - | - | |
| Harald | 880,1 | 28,4 | 30,9 | 29,9 | 880,1 | |
| Lulita | 53,2 | 1,7 | 3,3 | 2,2 | 53,2 | |
| Halfdan | 4.970,4 | 160,3 | 144,1 | 123,8 | 4.970,4 | |
| Siri | 92,9 | 3,0 | 2,6 | 9,2 | 92,9 | |
| Syd Arne | 662,6 | 21,4 | 25,3 | 38,0 | 662,6 | |
| Tyra SE | 2.865,3 | 92,4 | 85,7 | 81,7 | 2.865,3 | |
| Cecilie | 9,0 | 0,3 | 0,3 | 0,3 | 9,0 | |
| Nini | 42,7 | 1,4 | 1,3 | 2,4 | 42,7 | |
| Ravn | 2,4 | 0,1 | 0,1 | - | 2,4 | |
| Total | 15.356,0 | 495,4 | 491,0 | 483,6 | 15.356,0 | |
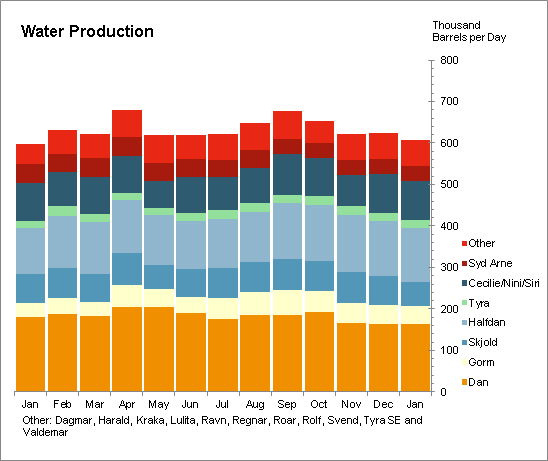
| Water, 1000 barrels | January 2018 | Oct17-Dec17 | Oct16-Dec16 | This year |  | |
| Field | Monthly | Daily Avg. | Daily Avg. | Daily Avg. | ||
| Dan | 5.094,7 | 164,3 | 173,6 | 174,0 | 5.094,7 | |
| Gorm | 1.287,1 | 41,5 | 49,4 | 41,4 | 1.287,1 | |
| Skjold | 1.825,3 | 58,9 | 71,4 | 74,5 | 1.825,3 | |
| Tyra | 594,4 | 19,2 | 20,6 | 26,7 | 594,4 | |
| Rolf | 99,4 | 3,2 | 6,4 | 6,8 | 99,4 | |
| Kraka | 204,0 | 6,6 | 5,9 | 6,8 | 204,0 | |
| Dagmar | - | - | - | - | - | |
| Regnar | - | - | - | - | - | |
| Valdemar | 369,5 | 11,9 | 10,3 | 9,2 | 369,5 | |
| Roar | 669,1 | 21,6 | 19,7 | 10,5 | 669,1 | |
| Svend | - | - | - | - | - | |
| Harald | 25,2 | 0,8 | 0,9 | 0,3 | 25,2 | |
| Lulita | 36,5 | 1,2 | 2,2 | 1,4 | 36,5 | |
| Halfdan | 4.063,6 | 131,1 | 135,7 | 114,9 | 4.063,6 | |
| Siri | 2.217,5 | 71,5 | 64,3 | 64,4 | 2.217,5 | |
| Syd Arne | 1.087,9 | 35,1 | 36,1 | 46,0 | 1.087,9 | |
| Tyra SE | 517,7 | 16,7 | 14,1 | 12,8 | 517,7 | |
| Cecilie | 275,4 | 8,9 | 8,4 | 9,1 | 275,4 | |
| Nini | 425,6 | 13,7 | 14,2 | 11,1 | 425,6 | |
| Ravn | - | - | - | - | - | |
| Total | 18.792,9 | 606,2 | 633,1 | 609,8 | 18.792,9 | |
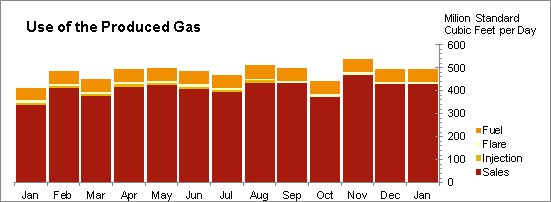
| Use of produced gas, MMscf | ||||||
| January 2018 | Oct17-Dec17 | Oct16-Dec16 | This year |  | ||
| Monthly | Daily Avg. | Daily Avg. | Daily Avg. | |||
| Fuel | 1.776,0 | 57,3 | 57,1 | 58,4 | 1.776,0 | |
| Flare | 262,2 | 8,5 | 10,1 | 9,4 | 262,2 | |
| Injection | 30,9 | 1,0 | 0,7 | 8,0 | 30,9 | |
| Sales | 13.320,9 | 429,7 | 423,3 | 407,7 | 13.320,9 | |
| Total | 15.390,0 | 496,5 | 491,2 | 483,6 | 15.390,0 | |
| Notes: | ||||||
| Sif and Igor production is included in Halfdan production. | ||||||
| Digit grouping symbol is a dot "." and decimal symbol is a comma ",". | ||||||
| Nm3 (normal cubic metres) is at standard conditions 0°C and 1,01325 bar. | ||||||
| Small differences between the total for "gas" and "use of produced gas" can occur. Earlier these differences were corrected, but this is not done anymore. | ||||||